
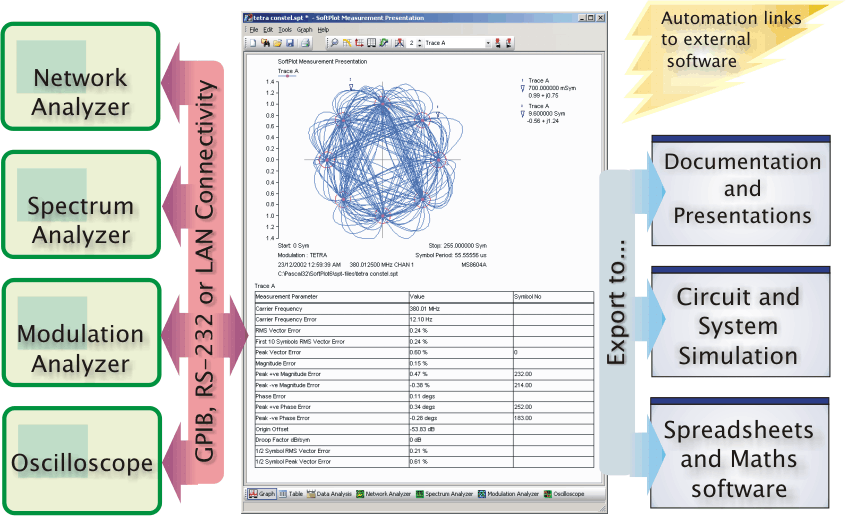
Use SoftPlot to transform your measurements into high quality plots in documents and presentations. Many instruments, such as spectrum analyzers and network analyzers, have the capability to generate a hard copy of the measurements by connecting a suitable pen-plotter to their GPIB interface. SoftPlot improves on this by using the GPIB to extract the trace data from the instrument and then allowing you to manipulate it in a number of ways. For example, the graticule type, style and scaling can be re-defined, and markers and limit lines added. In addition, the graph can be annotated in various ways, and if there are several traces they can be drawn in different pen styles and colours.
The resulting measurement is packaged by SoftPlot in a way that can be electronically pasted into a word processor document (or slide presentation, etc.). This makes use of the Object Linking and Embedding (OLE) capability of Windows applications.
When an embedded or linked SoftPlot object in a document is double-clicked, SoftPlot will be started and the measurement data displayed for editing. Any changes made are automatically reflected in the destination document when SoftPlot is closed.
SoftPlot and Network Analyzers
SoftPlot and Spectrum Analyzers
SoftPlot and Modulation Analyzers
Features Summary, Hardware Requirements, Pricing and Ordering