
Modulation Analyzers come in various forms, to handle the wide range of digital modulation techniques in use today. SoftPlot has a generalised range of presentation formats and a configuration dialogue box to set up all the parameters for any modulation type.
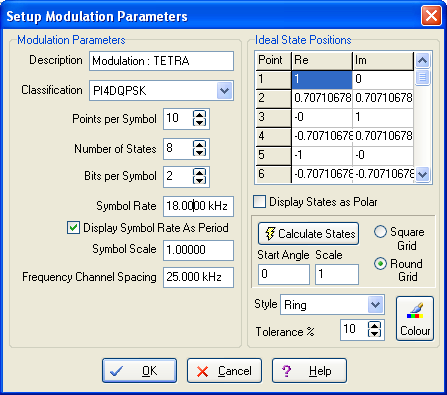
The positions of the ideal symbol positions are shown on the graph using crosses or circles, and these can be set up automatically with the modulation data transfer from the instrument. Alternatively, there is a facility to calculate the symbol state positions after entering the number of states and whether they lie in a square or circular pattern.
As with network analyzer measurements, the philosophy behind SoftPlot is to allow the measurement to be presented in various ways after it has been collected. The vector trajectory representation is the most general, and can be formatted as a constellation, or I / Q versus time, or as an eye diagram.
Symbol identification dots can be turned on to highlight where the measurement data points are at the symbol timing interval.
Commonly, vector analyzers have a facility to report performance statistics on the modulation measurement. SoftPlot has a Data Analysis table associated with each trace store, which can be filled in by the instrument over GPIB. Where provided by the instrument, this can include pass/fail indication against specification limits (e.g. IFR 2310 Tetra Analyzer).
Additionally, there are marker readout modes to indicate EVM (Error Vector Magnitude), phase error, and IQ error at any given symbol point in the trace.
SoftPlot and Network Analyzers
SoftPlot and Spectrum Analyzers
Features Summary, Hardware Requirements, Pricing and Ordering