
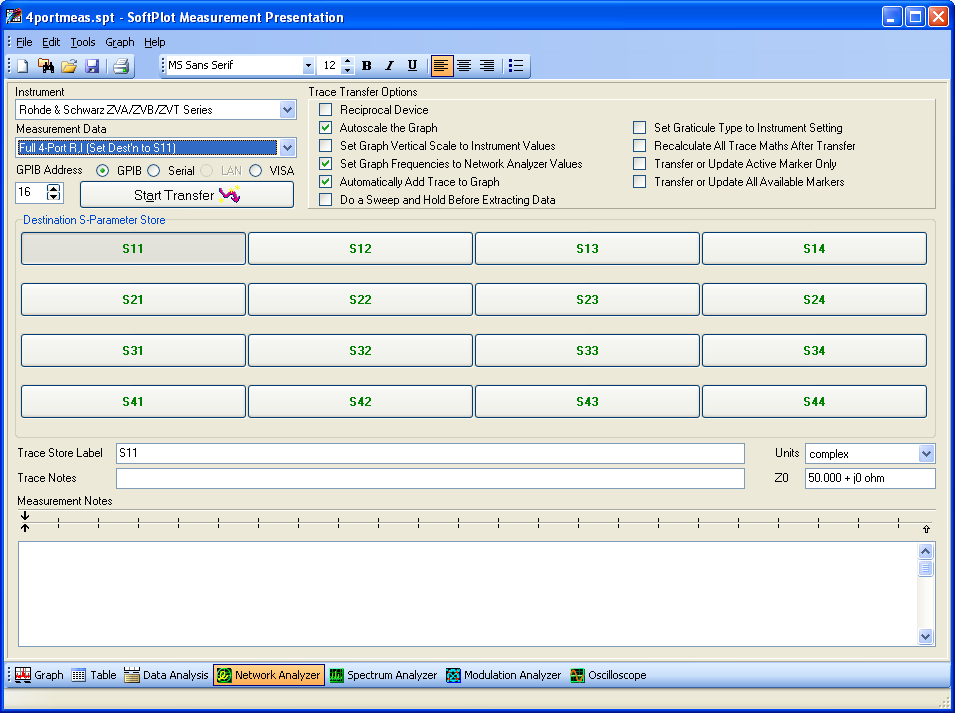
SoftPlot has the ability to accumulate up to 16 S-Parameter measurements. These can either be a family of measurements (e.g. a log of progress during an experiment, or measurements at different bias conditions), or they can be organised as an S-Parameter matrix.
Because the measurement data is collected and stored as complex real and imaginary pairs, it can be formatted to any of the display types found on your network analyzer. For example, choose between a Smith chart or VSWR or group delay representation.
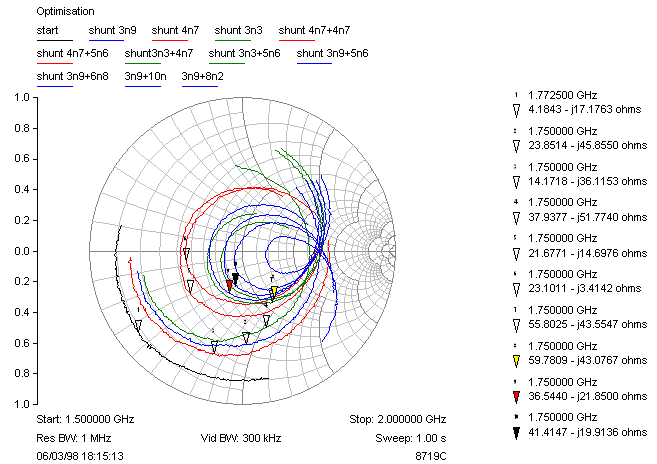
Of key interest to RF circuit and system designers is the ability to read and write S-Parameter files in a format compatible with the major circuit simulators such as Libra or Touchstone (TM HP-EEsof), Super Compact (TM Ansoft). Real-life measurements can be inserted as black-box components in a larger sub-system simulation, or as an optimiser target to find an equivalent model for a circuit suffering from layout parasitics or crosstalk. You can even use SoftPlot to view manufacturers' S-Parameter library files.
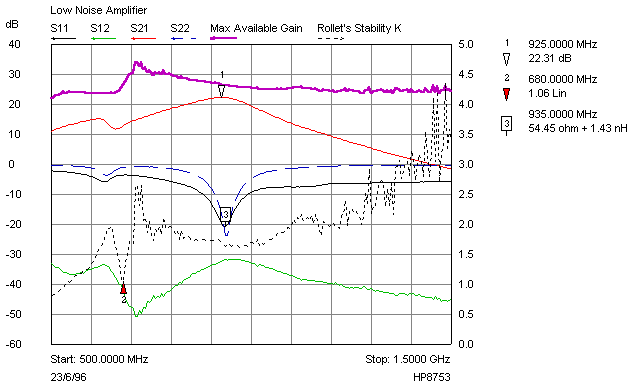
Marker readout format can be independent of the graph format, so the readout can be magnitude and phase, or it can calculate the equivalent Resistor-Capacitor or Resistor-Inductor network. Use Trace Maths to calculate Rollet's stability factor and Maximum available gain on amplifier measurements.
SoftPlot and Spectrum Analyzers
SoftPlot and Modulation Analyzers
Features Summary, Hardware Requirements, Pricing and Ordering