
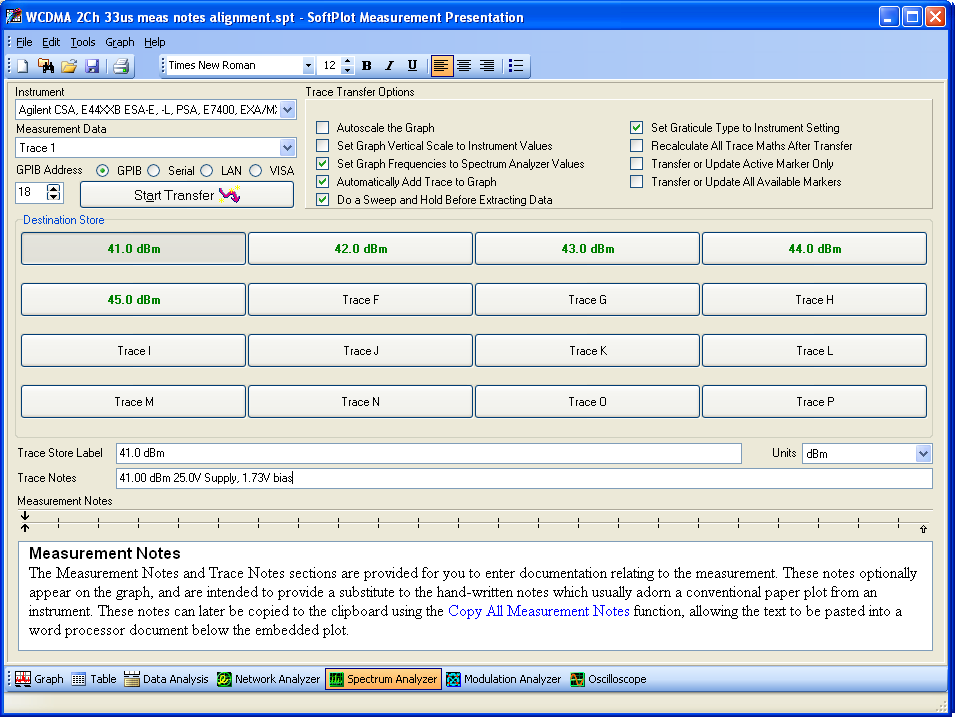
As with any of the types of instrument supported by SoftPlot, up to 16 measurements can be acquired into one SoftPlot file. Overlay successive traces during an experiment, logging your progress at each stage. There is provision for trace notes associated with each trace store, so SoftPlot can become your lab notebook. Then show or hide a subset of those measurements to look for finer details or important trends without unnecessary clutter.
Many spectrum measurements are checked against limits. SoftPlot allows you to enter spectrum masks, emissions limits or reference lines. Up to 20 arbitrary segments can be defined and edited in a convenient table. Each segment can be defined with absolute values, or relative to the graph reference level, start or centre frequency as appropriate. Limits testing can be set up individually for each segment as an upper or lower limit. Additionally, segments can be purely visual and excluded from testing. A pass/fail stamp appears on the lower left or right to show the result of the limits test. A marker readout format is provided to show the difference between the limits and the trace, allowing a search for failures or marginal passes.
Correct for the response of a filter or an external mixer, or perhaps even the response of your anechoic chamber and test antennas. Built-in trace maths allows a wide range of mathematical expressions between trace stores or complex constants. Results are stored as new traces, allowing them to be used in further calculations.
Measurements don't have to be on a 10 x 10 grid. The vertical lines can be at user - defined channel intervals, or automatically adjusted to be at whole-number frequencies, or even in log-axis format for Bode analysis.
Take this spectrum measurement... and reformat it to show the phase noise profile
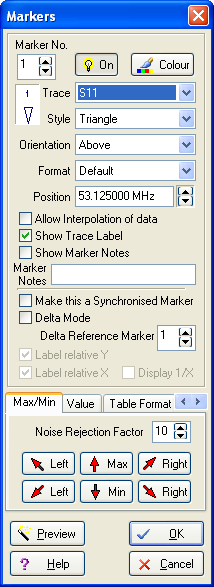
There are standard markers and delta mode markers. Up to 20 markers can be configured in total, with room to display 12 in the marker list on the graph. Each can be a different colour, can be orientated above, below, to left, or to right of the measurement. Choose from triangle, filled triangle, rectangle, lollipop or arrow styles.
Marker functions for finding peaks and troughs are provided to locate features of interest quickly. As important are the interactive marker controls on the main screen which allow you to rapidly wind the markers through the traces.

Specifically aimed at spectrum measurements is the ability to calculate dBc/Hz, dBm/Hz, and integrated power over a bandwidth given by a pair of markers. These all account for the resolution bandwidth of the analyzer, and also allow a fine correction to be entered to account for the non-rectangular nature of the IF filter pass-band. Use this to show oscillator phase noise at a particular offset from carrier, or to show the cumulative effect of an arbitrary phase noise profile or modulation spectrum in an adjacent channel.

SoftPlot and Network Analyzers
SoftPlot and Modulation Analyzers
Features Summary, Hardware Requirements, Pricing and Ordering